October 2026
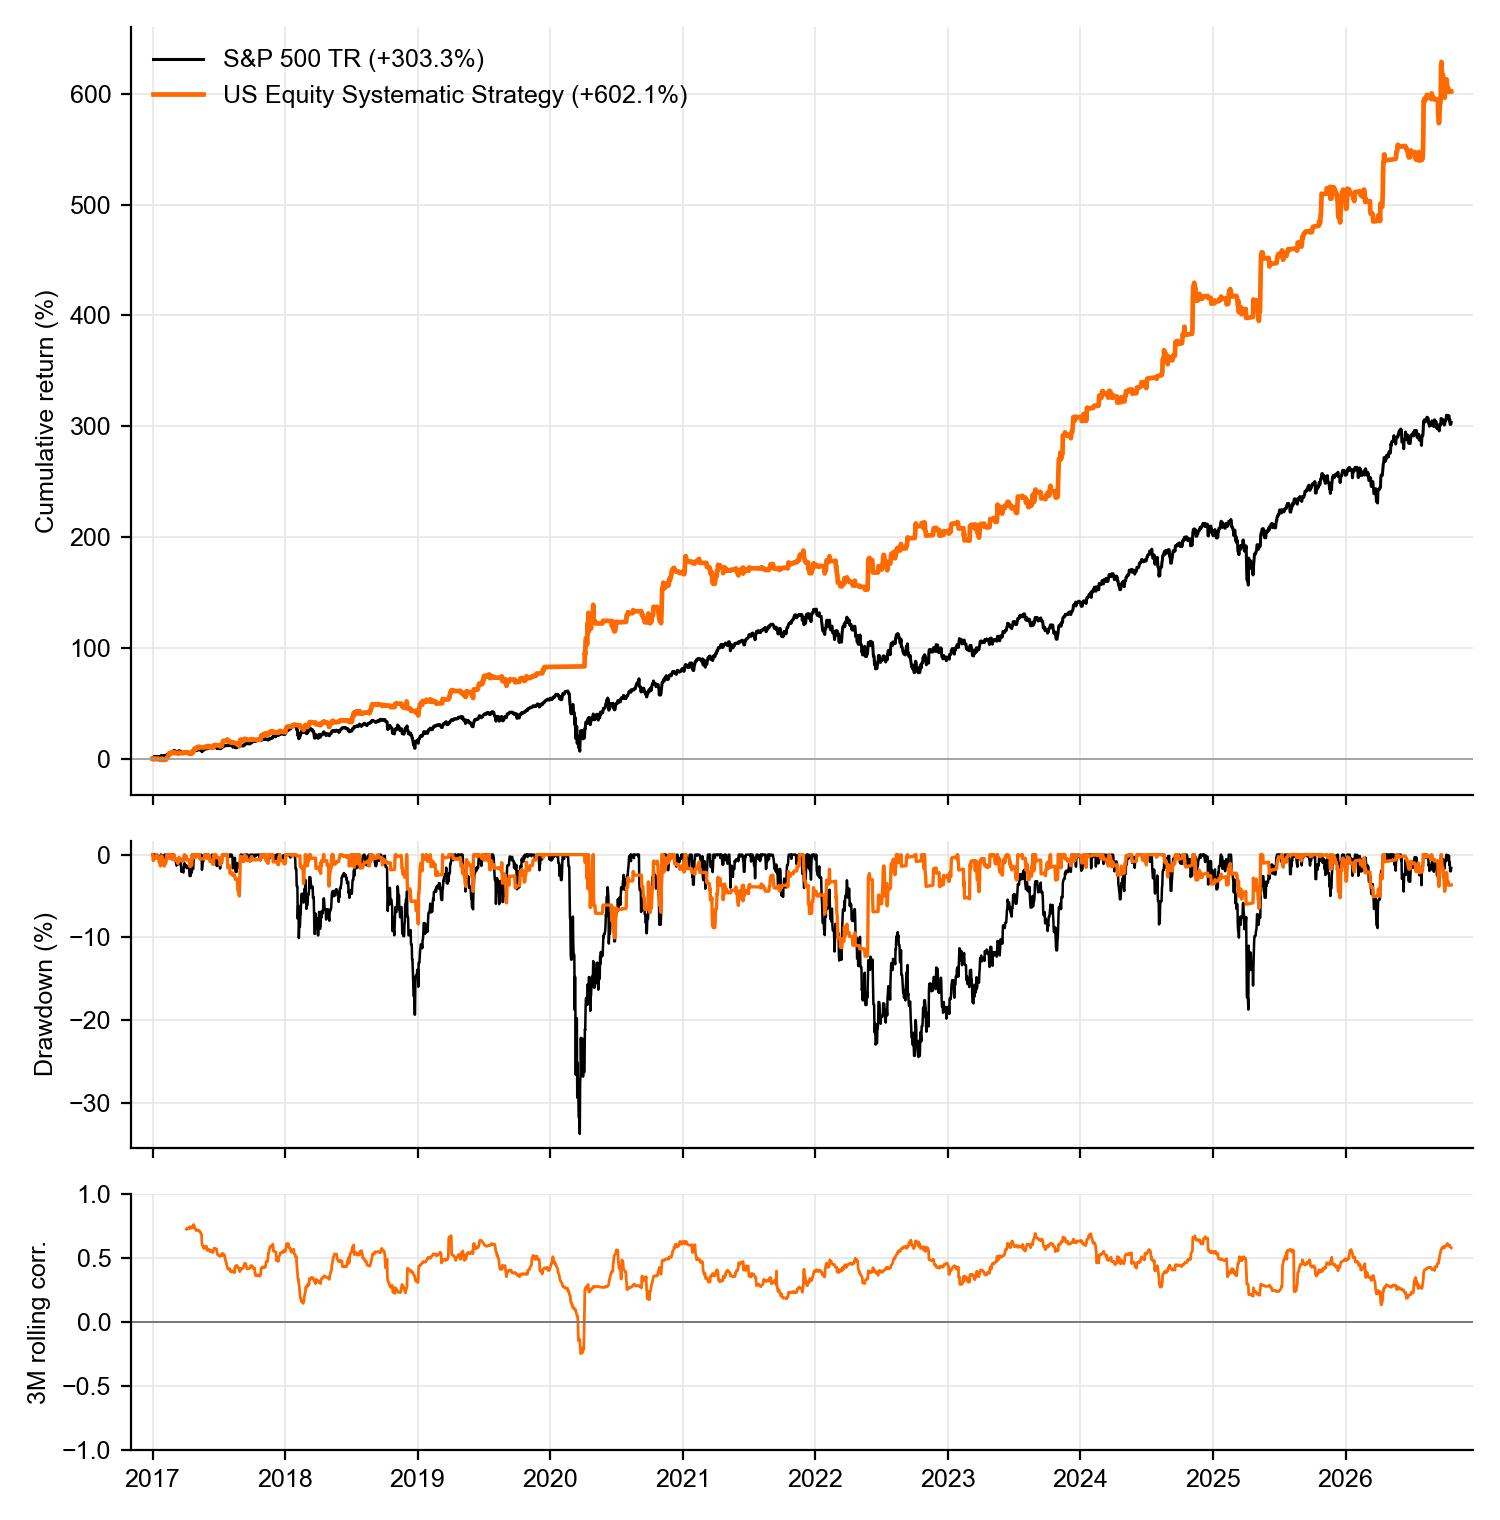
The strategy relies on a fully systematic, long-only approach on US equity index futures that seeks to identify the exhaustion of prevailing trends and position for their reversal across multiple time horizons.
Gross notional exposure is capped at 2x. Risk is managed dynamically through a trailing stop system. Excess cash is invested in short-term US Treasury bills. The result is a positively skewed return profile with low correlation to, and contained drawdowns relative to, the S&P 500 Total Return Index.
The below performance is simulated and does not represent actual trading.
US Equity Systematic Strategy
- CAGR
- +22.0% S&P 500: +15.3%
- Sharpe ratio
- 1.44 S&P 500: 0.73
- Max drawdown
- -12.3% S&P 500: -33.8%
- Correlation (daily)
- 0.37 S&P 500: 1.00
Cumulative return, drawdown and correlation
Performance statistics
| Strategy | S&P 500 | |
|---|---|---|
| Total return (Jan 2017 - Oct 2026) | +602.1% | +303.3% |
| CAGR | +22.0% | +15.3% |
| Annualized volatility | 12.7% | 18.2% |
| Sharpe ratio | 1.44 | 0.73 |
| Max drawdown | -12.3% | -33.8% |
| Best month | +24.1% | +12.8% |
| Worst month | -6.1% | -12.4% |
| Positive months | 72.0% | 69.5% |
| Correlation with S&P 500 (daily) | 0.37 | 1.00 |
| Beta to S&P 500 (daily) | 0.26 | 1.00 |
| Execution fee cumulative drag % | -2.3% | |
| Excess cash cumulative performance % | +68.0% | |
| Stop-loss | Trailing and max risk set at -1.25% of the portfolio per trade | |
| Leverage | 2x max | |
Simulated returns (net of execution fees).
Monthly and annual returns
| Jan | Feb | Mar | Apr | May | Jun | Jul | Aug | Sep | Oct | Nov | Dec | Year | |
|---|---|---|---|---|---|---|---|---|---|---|---|---|---|
| 2017 | -0.9 | +5.8 | +0.6 | +3.0 | +1.4 | +1.5 | +3.2 | +1.4 | +0.2 | +3.4 | +1.9 | +0.1 | +23.7 |
| 2018 | +5.3 | -1.3 | +1.8 | +0.8 | +1.4 | 0.0 | +5.1 | +6.0 | -0.5 | +0.6 | -1.5 | -3.5 | +14.5 |
| 2019 | +7.1 | -1.4 | +4.9 | +2.2 | -2.0 | +8.6 | +1.2 | -1.0 | -1.2 | +2.0 | +2.5 | +3.3 | +28.9 |
| 2020 | +0.1 | +0.1 | +0.1 | +24.1 | -1.4 | -1.7 | +4.1 | +1.5 | -3.4 | -0.4 | +18.2 | +1.4 | +47.1 |
| 2021 | +2.9 | +0.1 | -6.1 | +4.1 | -0.3 | +0.4 | +0.5 | +1.1 | -1.3 | +1.8 | +2.6 | -2.9 | +2.3 |
| 2022 | +0.1 | -0.7 | -4.6 | -1.7 | +9.0 | -3.0 | +4.8 | +2.1 | +3.2 | +2.4 | +0.7 | -0.9 | +11.0 |
| 2023 | +0.8 | -3.5 | +4.7 | +1.5 | +1.7 | +1.8 | +2.7 | +2.1 | -1.7 | +0.2 | +16.1 | +4.2 | +33.8 |
| 2024 | +1.9 | +2.8 | +0.1 | -1.4 | +1.8 | +1.4 | +2.1 | +4.0 | +2.5 | +1.9 | +6.6 | -0.8 | +25.1 |
| 2025 | +0.8 | +0.4 | -2.4 | +1.8 | +7.4 | +0.7 | +0.7 | +0.7 | +2.0 | +6.0 | +1.0 | -1.9 | +18.1 |
| 2026 | +1.3 | -1.4 | -2.7 | +9.2 | +1.9 | -0.5 | -1.1 | +8.5 | +1.1 | -0.2 | – | – | +16.3 |
Simulated returns in %.
Strategy against the S&P 500, year by year
| 2017 | 2018 | 2019 | 2020 | 2021 | 2022 | 2023 | 2024 | 2025 | 2026 YTD | |
|---|---|---|---|---|---|---|---|---|---|---|
| Strategy | +23.7% | +14.5% | +28.9% | +47.1% | +2.3% | +11.0% | +33.8% | +25.1% | +18.1% | +16.3% |
| S&P 500 | +21.8% | -4.4% | +31.5% | +18.4% | +28.7% | -18.1% | +26.3% | +25.0% | +17.9% | +13.4% |
| Excess return % | +1.9 | +18.9 | -2.5 | +28.7 | -26.4 | +29.1 | +7.5 | +0.1 | +0.3 | +3.0 |
Simulated returns in %.
Frequency distribution of simulated returns
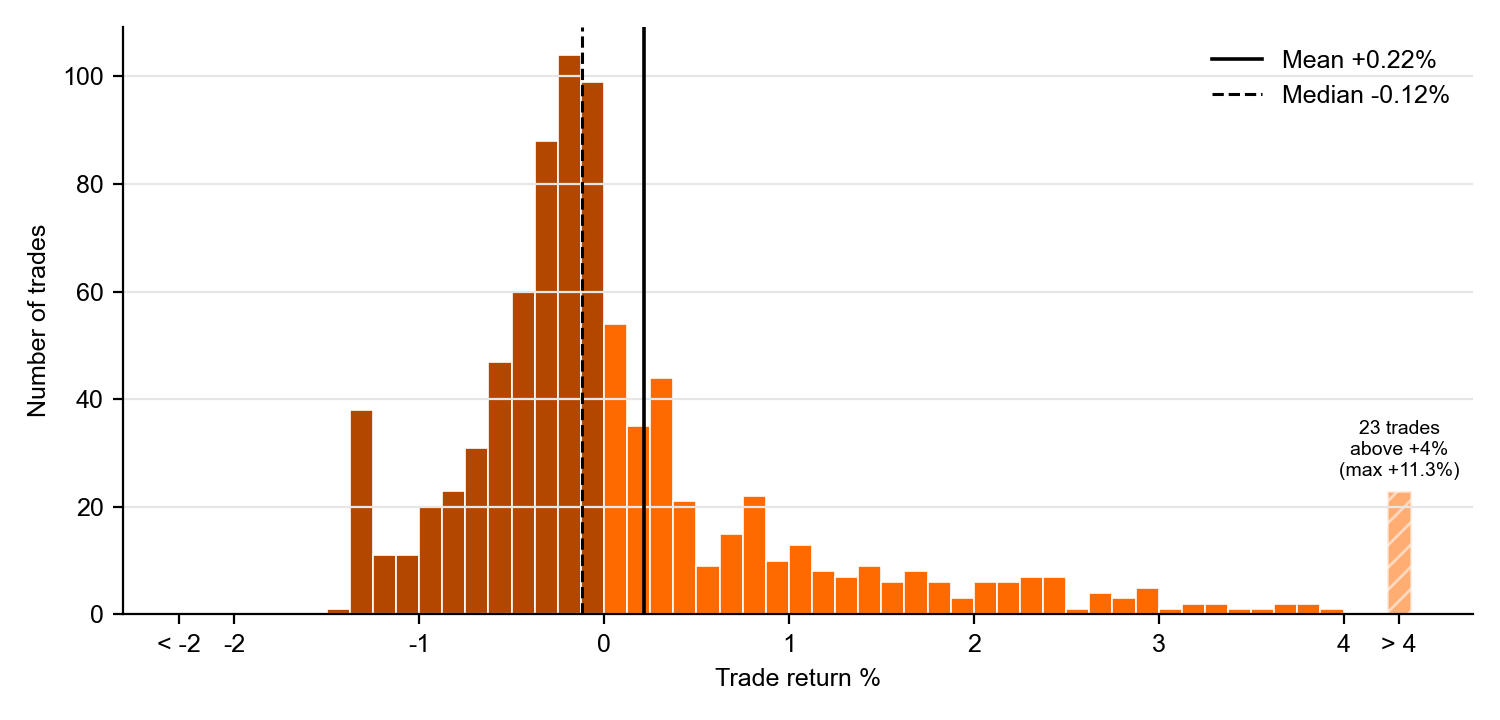
Each trade P&L (net of execution fees) as % of the portfolio value (dark orange: losing trades, bright orange: winning trades).
Trade return statistics
| Strategy | |
|---|---|
| Number of trades | 877 |
| Mean return per trade | +0.22% |
| Median return per trade | -0.12% |
| Standard deviation | 1.30% |
| Win rate | 39.2% |
| Profit factor¹ | 1.70 |
| Average winning trade | +1.24% |
| Average losing trade | -0.44% |
| Best trade | +11.28% |
| Worst trade | -1.38% |
| Average trade duration | 1.8 days |
| Average winning/losing trade duration | 3.5 / 0.7 days |
| 5th / 95th percentile | -1.17% / +2.72% |
| 25th / 75th percentile | -0.41% / +0.35% |
| Skewness | 3.07 |
| Share of total gains from top 10 trades | 20.3% |
¹ Profit factor: sum of the profits of the winning trades divided by the sum of the losses of the losing trades, net of execution fees.
Performance disclosure
Past results are not indicative of future results.
These results are based on a performance simulation and do not represent actual trading. Simulated returns have certain inherent limitations that may cause actual returns to differ from simulated ones. In addition, simulated results depend on the historical liquidity conditions prevailing at the time of trading and on the data resolution used in the backtest.
Notes and assumptions
The simulation starts with an initial capital of USD 1,000,000.
Maximum leverage is set at 2x the portfolio value. Leverage is calculated as the contract value of the open positions at the entry price divided by the total value of the portfolio.
As of October 2026, the most recent trade sizes were 18 lots for ES and 12 lots for NQ. Concurrent trades on the same future are not permitted. Risk is managed dynamically through a trailing stop-loss system. In addition, no individual trade may generate a loss greater than 1.25% of the portfolio value; if this threshold is breached, the position is closed at the next available price. Slippage is not accounted for in the calculations.
Futures initial margin is assumed to be 10% of the contract value. Excess cash is invested at the prevailing one-month US Treasury bill rate and rolled forward over time.
Time series are adjusted for contract rolls. Positions open at contract expiry are rolled at a cost of one tick per lot.
Execution fee: USD 2 per lot. All returns shown are net of execution fees.
The simulation is run on a walk-forward basis using one-minute OHLCV bars. This choice is computationally efficient and is acceptable provided that entry and stop-loss levels are not hit within the same one-minute interval. Apart from this particular case, one-minute resolution offers the same precision as tick-by-tick data. Further details on data sampling and backtest methodology are available upon request.